
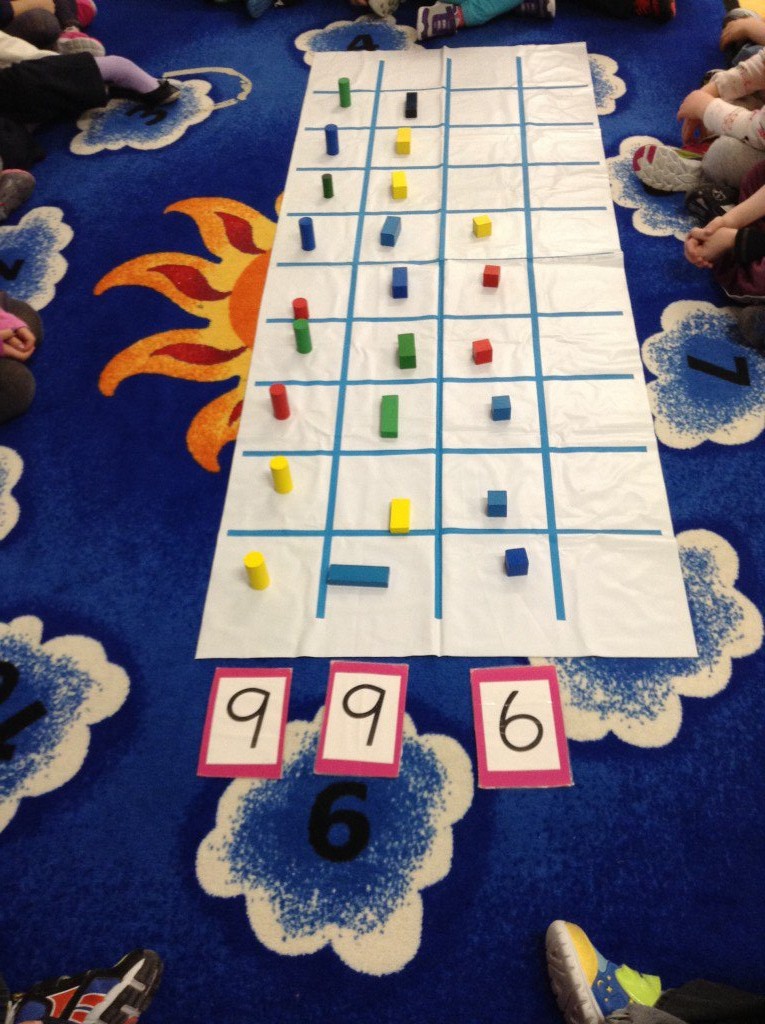
We have been working on taking surveys with our friends. “Do you like milk, juice, water, etc.?” “Do you like apples, oranges, grapes, etc.?” We used tally marks with our surveys. We also sorted collections of things and created 2 and 3 column graphs. We created picture and bar graphs and then interpreted our findings. For example: “more like apples”, “fewer or less like water”. We have been working at describing our graphs in terms of more and less. We also have been working at not counting to determine more or less, but looking at our graphs to determine more or less.